 RAIDEN
 How to Properly Benchmark Solana Raw Shred Streams
Benchmarking Solana raw shred streams: why per-shred and transaction-signature latency tests measure the wrong thing — and why FEC recoverability wins.
Benchmarking Solana raw shred streams: why per-shred and transaction-signature latency tests measure the wrong thing — and why FEC recoverability wins.
There are several ways to benchmark Solana shred streams. Some benchmarks compare the arrival time of every individual shred. Others decode both streams and compare when the same transaction signature becomes visible. Both approaches can generate impressive latency charts and very large sample counts.
But if the product being benchmarked is a raw shred stream, neither isolates the thing we actually want to know:
Which stream gives the consumer enough information to use each FEC set first?
That distinction matters because Solana shreds are not consumed as independent packet races. They belong to erasure-coded FEC sets, and once enough distinct information has arrived, missing shreds can be reconstructed locally. That gives a raw-shred benchmark a natural start and a natural finish line.
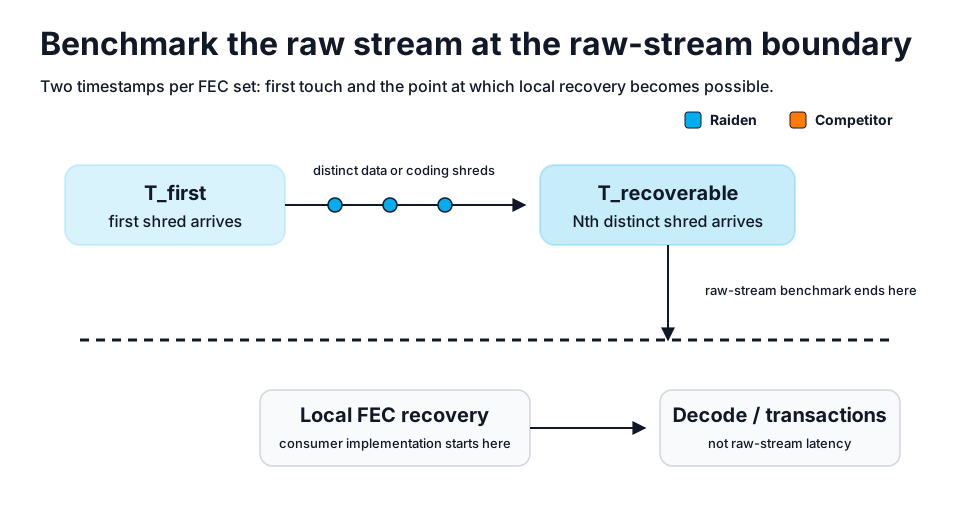
This article is about raw shred delivery. It is not about transaction decoding, transaction-signature extraction, Yellowstone gRPC, RPC response time, or the speed of a particular consumer implementation. A raw-stream benchmark should therefore stop before those downstream stages begin.
For every FEC set, two timestamps are especially meaningful:
T_first — the arrival time of the first shred observed for that FEC set.T_recoverable — the arrival time of the Nth distinct shred that makes local recovery possible.The first answers: which stream exposed this FEC set first? The second answers: which stream gave the consumer enough information to reconstruct the missing data first? For a raw shred stream, the second question is the critical one.
A common benchmark matches every shred between two providers and asks which copy arrived first. Conceptually:
match shred
    ↓
timestamp stream A
timestamp stream B
    ↓
A wins / B wins
After millions of comparisons, the result might say:
Stream A: 37.5% first
Stream B: 62.5% first
That statistic may be calculated correctly. The problem is the conclusion drawn from it. A FEC set is not simply 64 independent packet races whose votes should all have equal weight. Once enough distinct data and coding shreds have arrived, the missing data can be reconstructed locally. Network arrivals after that point no longer determine when that FEC set became usable.
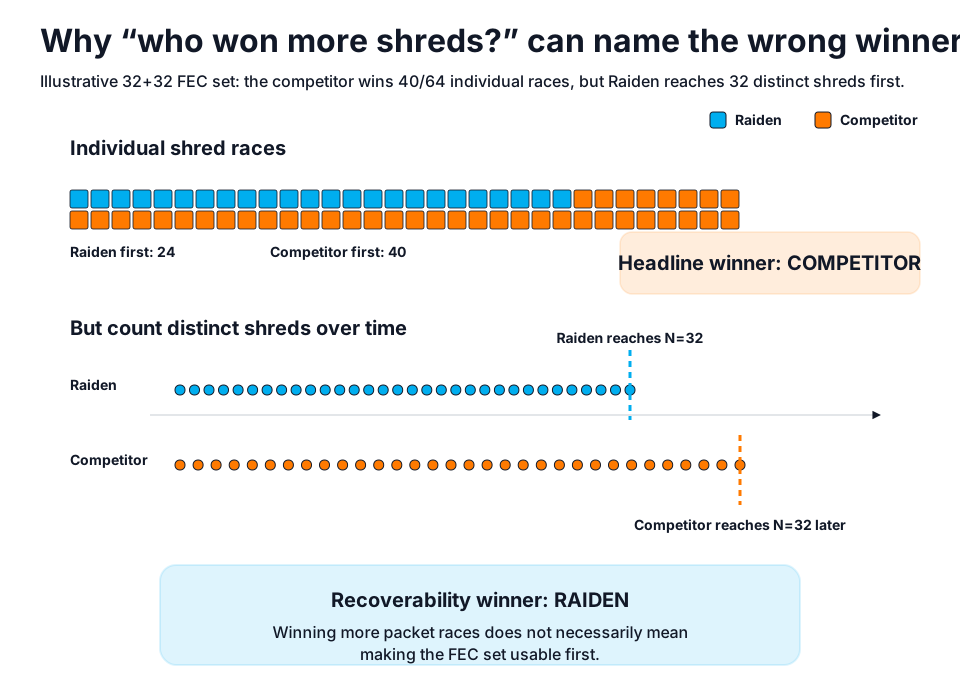
In the illustration, the competitor wins 40 of 64 individual shred races — 62.5%, so a per-shred benchmark declares the competitor the winner. But Raiden reaches the 32nd distinct shred first. So at the moment that matters for local FEC recovery, Raiden wins. Both observations can be true at the same time:
Most individual shreds won:  COMPETITOR
FEC recoverable first:       RAIDEN
The first metric describes packet races. The second describes time-to-usable raw data. They are not equivalent.
Instead of allowing one FEC set to generate dozens of independent "votes", treat the FEC set itself as the observation. For each provider:
T_first       = first shred seen for this FEC set
T_recoverable = moment recovery becomes possible
Then compare the two streams. The first-touch delta:
Δ_first = T_first(Raiden) − T_first(Competitor)
And the recoverability delta:
Δ_recoverable = T_recoverable(Raiden) − T_recoverable(Competitor)
With this sign convention:
negative delta  → Raiden earlier
positive delta  → Competitor earlier
This gives us two different views of the stream. One measures the leading edge. The other measures when the FEC set becomes locally recoverable. A provider can win one and lose the other. That is not a contradiction — it is useful information.
The benchmark must not simply hard-code N = 32. A FEC set becomes
recoverable at its Nth distinct shred, where N is derived from the coding
information for that FEC set.
The counter treats data and coding shreds interchangeably:
new data shred    → +1
new coding shred  → +1
duplicate shred   → +0
A duplicate never advances the recovery threshold. That is important because sending the same shred repeatedly should not make a provider look faster. The finish line is reached only when the consumer has accumulated enough distinct information.
Another popular approach is to decode both streams and compare when the same transaction signature becomes visible. That can be a valid benchmark — for an end-to-end transaction pipeline. It is not an isolated benchmark of raw shred delivery. Once the timestamp is taken at transaction availability, the measurement includes:
raw shred delivery
        +
FEC tracking and recovery
        +
entry reconstruction
        +
transaction decoding
        +
memory behavior
        +
CPU scheduling
        +
threading architecture
        +
client implementation
Different consumers can receive the exact same raw packets and still expose transactions at different times because their downstream software differs. So the rule is simple: if you benchmark raw shreds, measure raw-shred delivery and FEC recoverability; if you benchmark a decoded transaction stream — for example a pump.fun WebSocket feed — measure transaction availability. The mistake is to mix layers and then attribute all of the resulting latency to the raw feed.
For the results below, both feeds entered the same host through UDP sockets. Arrival
time was captured using SO_TIMESTAMPNS, giving both streams timestamps from the
same kernel clock before userspace scheduling becomes part of the measurement. The rest of
the benchmark follows the same principle: remove opportunities for the comparison tool
itself to manufacture an advantage.
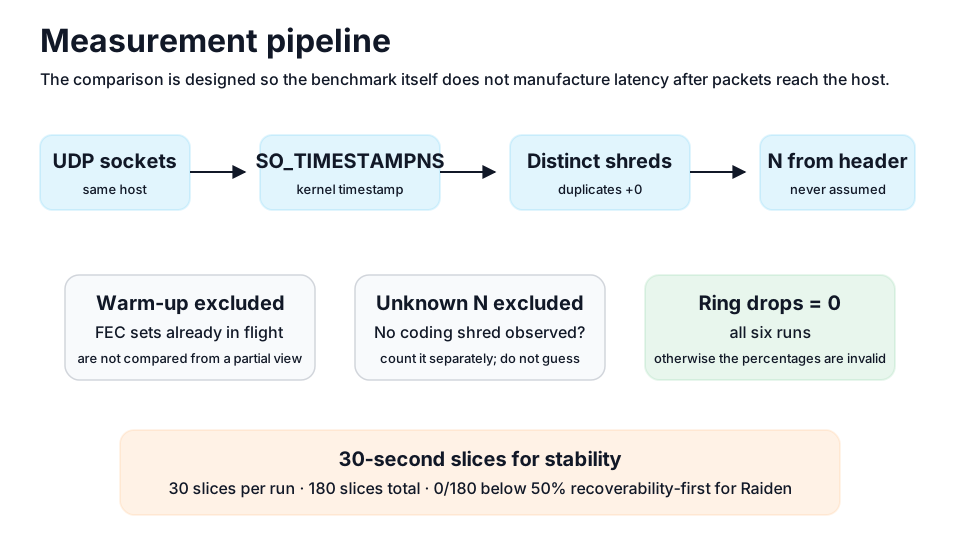
Ring drops: 0.
We ran six consecutive comparisons against a leading raw-shred competitor. Each run lasted
15 minutes, for a total observation time of 6 × 15 = 90 minutes. The
key result for each run is the percentage of comparable FEC sets for which each stream
reached the recoverability threshold first.
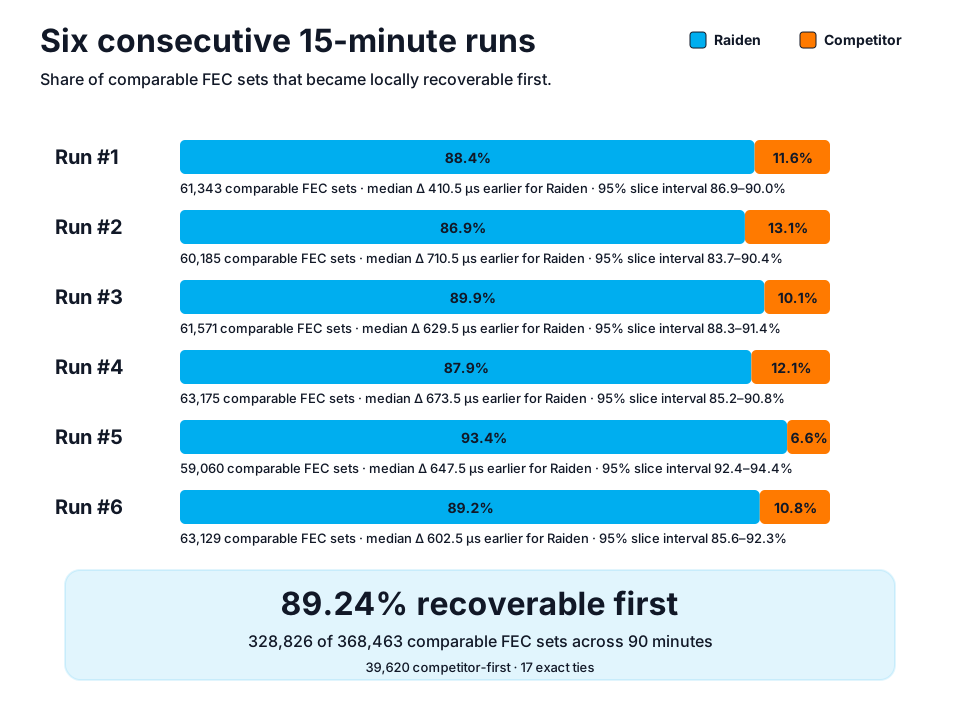
| Run | Comparable FEC sets | Raiden recoverable first | Competitor first | Median Δ | P10 Δ | 95% interval* |
|---|---|---|---|---|---|---|
| #1 | 61,343 | 88.4% | 11.6% | −410.5 µs | −6.208 ms | 86.9–90.0% |
| #2 | 60,185 | 86.9% | 13.1% | −710.5 µs | −5.532 ms | 83.7–90.4% |
| #3 | 61,571 | 89.9% | 10.1% | −629.5 µs | −5.801 ms | 88.3–91.4% |
| #4 | 63,175 | 87.9% | 12.1% | −673.5 µs | −5.806 ms | 85.2–90.8% |
| #5 | 59,060 | 93.4% | 6.6% | −647.5 µs | −5.787 ms | 92.4–94.4% |
| #6 | 63,129 | 89.2% | 10.8% | −602.5 µs | −5.535 ms | 85.6–92.3% |
*Intervals are derived from the spread across 30-second slices, not by pretending every FEC set is an independent experiment.
Across the six runs:
Comparable FEC sets:   368,463

Raiden first:          328,826
Competitor first:       39,620
Exact ties:                 17

Observed aggregate Raiden first: 89.24%
The 89.24% is a strong result. But it is not the main point of this article. The methodology is.
The same six runs show why measuring only the first packet is insufficient.
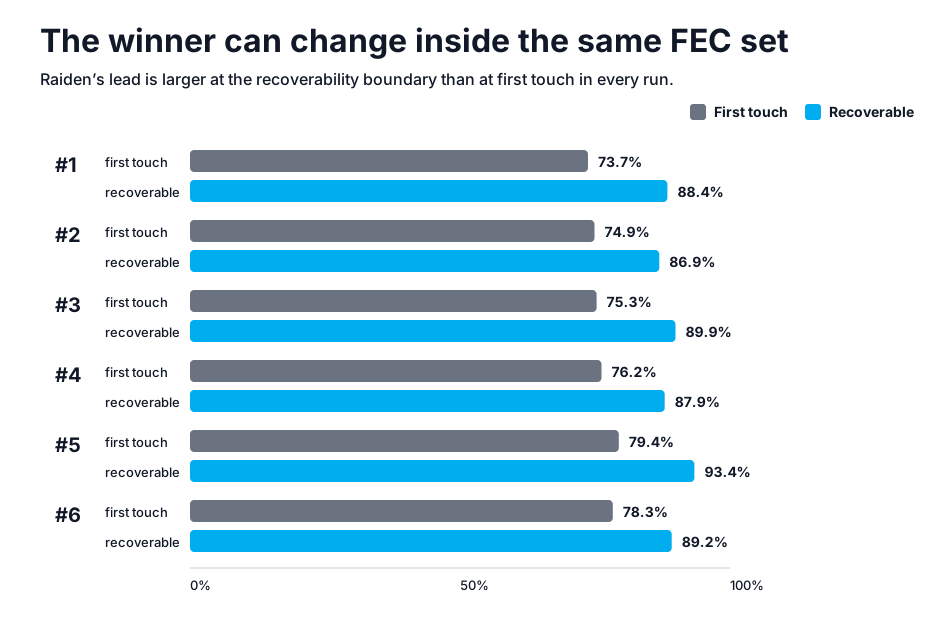
| Run | Raiden first at T_first | Raiden first at T_recoverable |
|---|---|---|
| #1 | 73.7% | 88.4% |
| #2 | 74.9% | 86.9% |
| #3 | 75.3% | 89.9% |
| #4 | 76.2% | 87.9% |
| #5 | 79.4% | 93.4% |
| #6 | 78.3% | 89.2% |
Raiden was already ahead at the leading edge. But in every run the advantage was materially larger at the point where the FEC set became recoverable. That tells us something a single first-packet metric cannot show:
How a feed starts delivering a FEC set and how quickly it delivers enough useful information are different properties.
Even after choosing the right finish line, we should not publish only a percentage. We also
need to know by how much one stream reaches that boundary earlier. For every
comparable FEC set, Δ = t(Raiden) − t(Competitor), so a negative delta means
Raiden earlier and a positive delta means the competitor earlier. The six median
recoverability deltas were all negative:
Run #1   −410.5 µs      Run #4   −673.5 µs
Run #2   −710.5 µs      Run #5   −647.5 µs
Run #3   −629.5 µs      Run #6   −602.5 µs
At P10 — the tenth of the distribution where Raiden was furthest ahead — the measured differences were all in the 5.5–6.2 ms range (−6.208, −5.532, −5.801, −5.806, −5.787, −5.535 ms). At P90 the values were essentially zero: approximately ±0.5 µs. That asymmetric distribution tells us far more than a headline such as "Provider X won Y% of shreds."
The competitor delivered substantially more shreds to the benchmark host in every run.
| Run | Raiden shreds received | Competitor shreds received | Raiden recoverable first |
|---|---|---|---|
| #1 | 3,940,887 | 5,042,323 | 88.4% |
| #2 | 3,867,611 | 4,913,488 | 86.9% |
| #3 | 3,955,217 | 5,039,599 | 89.9% |
| #4 | 4,059,824 | 5,199,693 | 87.9% |
| #5 | 3,793,761 | 4,839,079 | 93.4% |
| #6 | 4,059,913 | 5,177,071 | 89.2% |
That does not make the extra packets useless — they can matter for redundancy, completeness
and loss tolerance. But it demonstrates why packet volume is not
time-to-recoverability. Once enough distinct shreds exist locally to reconstruct the
missing data, additional network copies do not move T_recoverable backwards in
time. For this particular latency question, the finish line has already been crossed.
There is an easy way to make benchmark confidence look better than it really is. FEC sets
inside the same slot share a leader and occur under closely related network conditions.
Treating every batch as an independent random experiment would claim more precision than
the data supports. So for each 15-minute run we recalculated the same measurement
independently across 30 slices × 30 seconds — a time-series view of whether the
result survives different portions of the run, including changes in leaders and network
conditions. Across all six benchmarks, 6 × 30 = 180 slices. The number of
30-second slices in which Raiden's recoverability-first share fell below 50%:
0 / 180
That consistency is far more informative than attaching an artificially narrow confidence interval to hundreds of thousands of correlated FEC sets.
A trustworthy benchmark should make it possible to see what was excluded and why. For raw FEC comparisons that includes, at least: FEC sets already in flight when capture started; sets where the recovery threshold could not be determined; tracking-width exclusions; FEC sets reached by only one provider; FEC sets reached by neither; duplicate shreds; internal ring drops; and total raw shreds observed. The rule should be simple:
If N cannot be determined:      do not invent it.
If a FEC set was already in flight:  do not pretend you saw its beginning.
If your own benchmark dropped packets:  do not present the percentages as valid.
The goal is not to maximize a headline number. The goal is to make the measurement auditable and reproducible.
At minimum, a serious raw-shred comparison should disclose:
| Section | What to publish |
|---|---|
| Environment | test location, receiving architecture, timestamp source, whether both feeds share the same clock, test duration |
| FEC methodology | how FEC sets are identified, how N is determined, how distinct shreds are counted, how duplicates are handled, how partial sets are handled |
| First-touch results | number of comparable FEC sets, first-touch win rate, latency distribution |
| Recoverability results | number of comparable FEC sets, recoverability-first win rate, P10 / P50 / P90 deltas |
| Integrity | excluded observations, provider-only observations, ring drops, total shreds received |
| Stability over time | smaller time windows rather than only one aggregate result |
Without those details, it is difficult to know whether two apparently similar benchmark charts are even measuring the same thing.
Per-shred arrival statistics are not useless. Transaction-signature comparisons are not useless either. They simply answer different questions. A useful way to think about the stack:
RAW SHRED STREAM        → measure FEC delivery and recoverability
DECODED TRANSACTION     → measure transaction availability
YELLOWSTONE / gRPC      → measure client-visible messages
RPC                     → measure request / response behavior
The mistake is measuring one layer and presenting the result as if it isolated another. If we claim to benchmark raw shreds, then our primary latency boundary should remain inside the raw-shred layer.
A benchmark can be mathematically impeccable and still answer the wrong question. You can compare a hundred million shreds individually and calculate those packet-race statistics with extraordinary precision. But if the question is which raw shred stream gives an optimized consumer usable Solana data first?, then the protocol already gives us the natural abstraction. The FEC set is the unit. The first shred tells us when the set becomes visible. The Nth distinct shred tells us when the set becomes recoverable. That gives us the measurement window:
T_first          → raw network delivery
   ▼
T_recoverable    → local consumer processing begins
   ▼
FEC recovery / decoding / transactions
For raw-stream latency, the network race that matters ends at T_recoverable.
If you want to benchmark individual packet delivery, compare individual packets. If you want to benchmark transaction pipelines, compare transactions. But if you want to benchmark Solana raw shred streams, measure the structure the stream actually delivers: measure the FEC set, its first touch, its recovery threshold, and the latency delta — and publish enough methodology for someone else to reproduce the result.
Across the six consecutive runs shown here, covering 368,463 comparable FEC sets over 90 minutes, Raiden reached the recoverability threshold first in 328,826 cases — 89.24% of the observed total. That is the result. But the more important point is how we arrived there.
Benchmark the right thing.
A forward-error-correction set is a group of erasure-coded shreds — typically 32 data + 32 coding in the runs measured here. Once enough distinct shreds arrive (the Nth, read from the coding header), a consumer can locally reconstruct any that are missing, so the FEC set — not the individual shred — is the natural unit for a raw-stream benchmark.
Because a FEC set is not 64 independent packet races. A provider can win most single-shred races and still deliver the Nth distinct shred — the point where local recovery becomes possible — later. Per-shred win rates measure packet races, not time-to-usable data.
The arrival of the Nth distinct data-or-coding shred for a FEC set: the moment the missing shreds can be reconstructed locally. For a raw shred stream this is the finish line that matters; network copies arriving after it do not move it earlier.
No. Timing a transaction signature includes FEC recovery, entry reconstruction, decoding, memory behavior, CPU scheduling and the consumer's own implementation. It is a valid end-to-end pipeline benchmark, but it does not isolate raw shred delivery.
Across 368,463 comparable FEC sets over 90 minutes, Raiden reached the recoverability threshold first in 328,826 cases — 89.24% — with a negative median delta in every run and no 30-second slice below 50%. But the point of the article is the methodology, not the number.
Build on the same data
Free API key with 200,000 trial credits: full REST and WebSocket access to the same firehose that powers the Terminal. Connect a Solana wallet; no email, no card.